


Document Actions
gvSIG-Desktop 1.10. User Manual
gvSIG can generate basic statistics over raster layers, which you can access through the option "Raster properties" that opens a dialog window with multiple tabs containing information about the selected raster layer. Select the "General" tab to see the layer statistics.
The dialog window "Raster properties" can be accessed in two ways: by right-clicking the raster layer in the table of contents, or from the raster properties icon in the toolbar:

Raster Properties icon
In this tab, you can see the layer statistics grouped by band. For each band the following information is shown:
- Minimum: Minimum value in the band.
- Maximum: Maximum value in the band.
- RGB Minimum: Minimum RGB value in the band.
- RGB Maximum: Maximum RGB value in the band.
- Mean: The average of all the values in the band.
- Variance: The amount of variation within the values in the band.
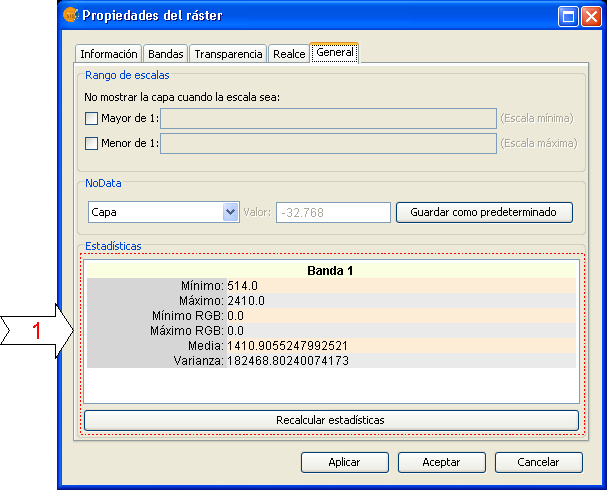
Raster properties window with image statistics
In case that the statistics are incomplete or erroneous, you can use the option "recalculate statistics" to regenerate the statistics.
Cached time 11/21/13 07:04:07 


